What's in a watt marshal report, section by section.
A report ranks the fixed-rate plans we can price in your delivery area by what each would cost over your year of usage. Here is what you see, in order, with pictures of a sample report. The plans and figures in the pictures are made up.
Before you pay: the free preview
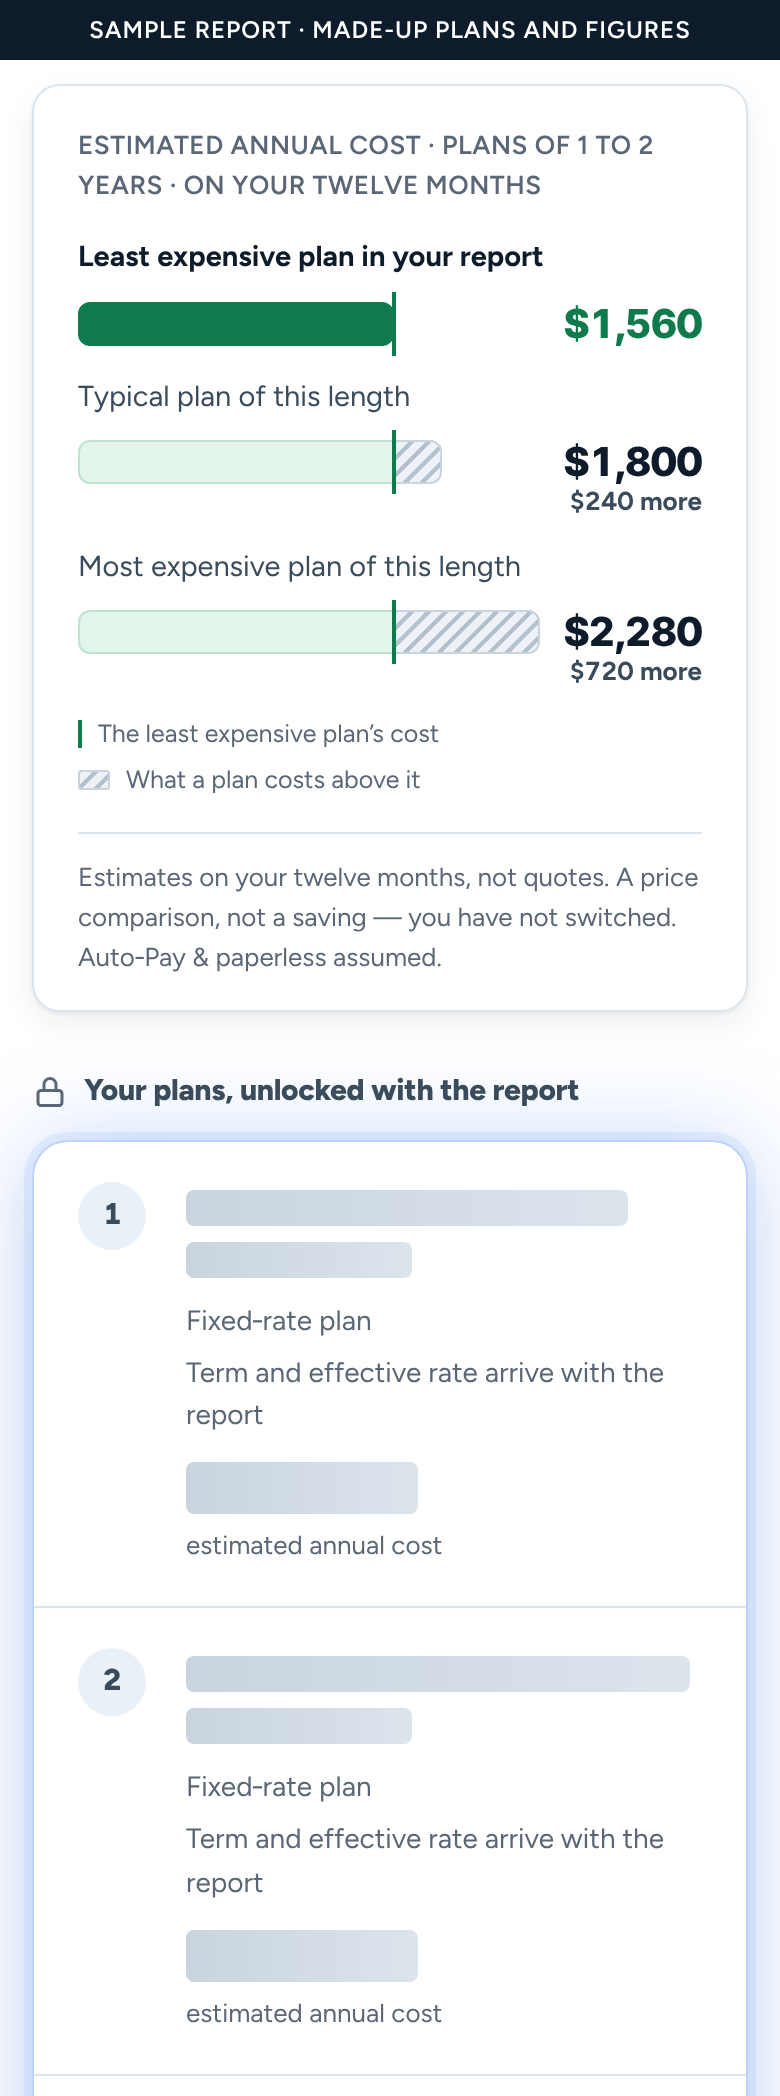
After you enter your ZIP code and your usage, you see a free preview. For one contract length, it shows what the least expensive plan, a typical plan and the most expensive plan would cost over your year, and how far apart they are. The plans are locked: you see how many there are, but not their names, providers or prices. Below them, you can check everything you entered before you buy.
The top of the report
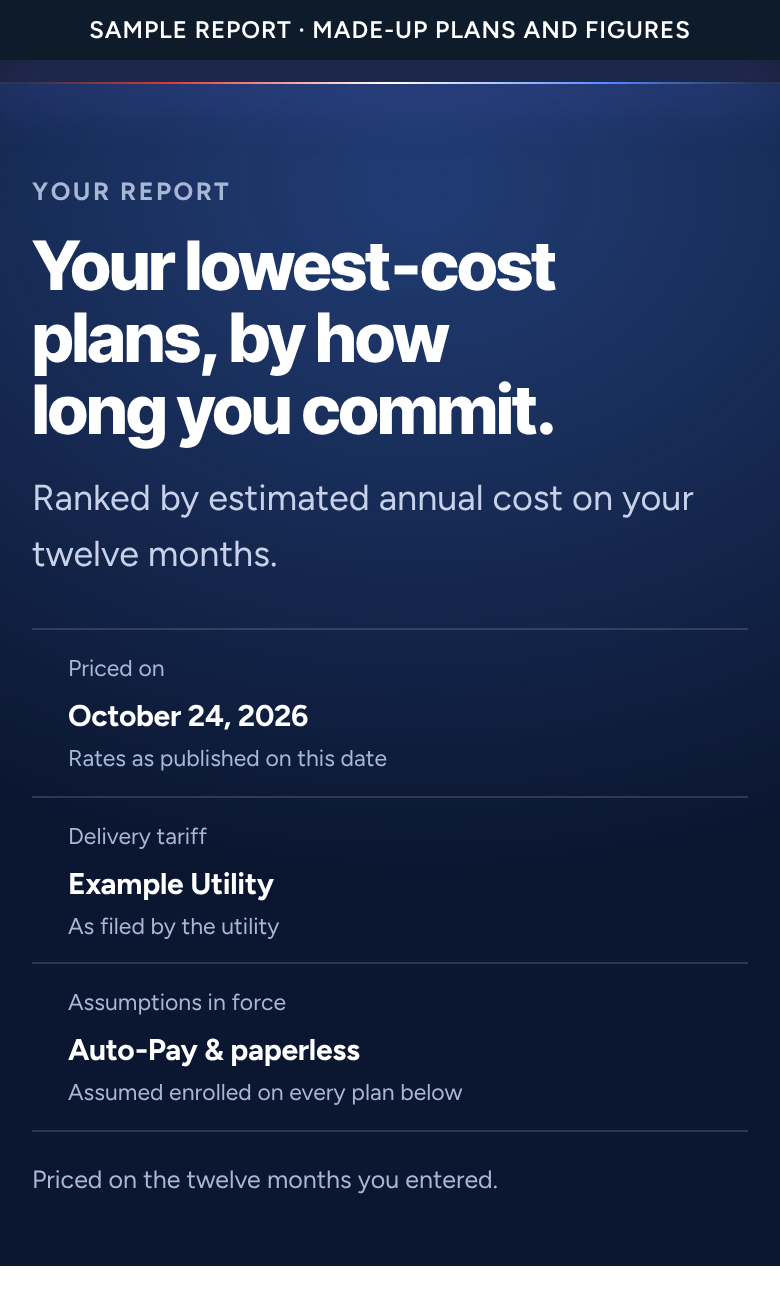
The report opens with what it was priced on: the date, since plans and prices change; your delivery utility, whose filed charges are in every figure; and the assumption that you enroll in Auto-Pay and paperless billing, which some plans need for their advertised price. It also says whether it used the twelve months you entered or the usage pattern for a home like yours.
Every contract length, ranked on its own
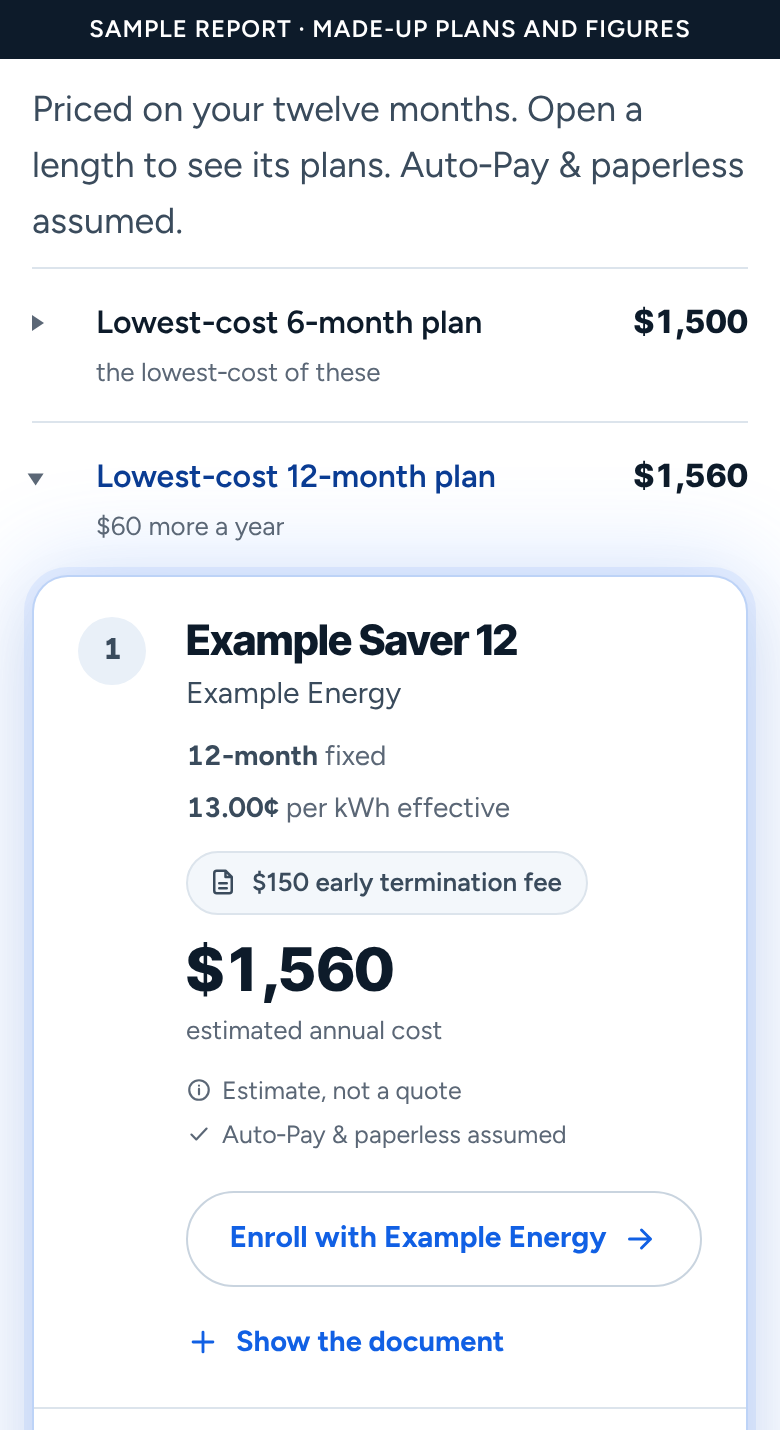
Next comes one row for each contract length: under a year, 1 to 2 years, 2 to 3 years, and 3 years or longer. Each row shows what that length's lowest-cost plan costs a year, and how much more that is than the lowest-cost length. Open a row to see its lowest-cost plans, ranked by estimated annual cost.
We never rank a short plan against a long one. A shorter plan puts you back in the market sooner, at prices nobody can know today. So the report shows what each length costs and leaves the choice to you.
Each plan, and the document behind it
Every plan in the list shows:
- its rank, its name and its provider;
- its contract length and effective price per kWh on your usage, with credits, fees and delivery charges included;
- its early termination fee, or a note that the label doesn't publish one, so you know to check;
- its estimated annual cost on your year;
- a link to sign up, or a note on how to ask the provider for the plan when it publishes no link;
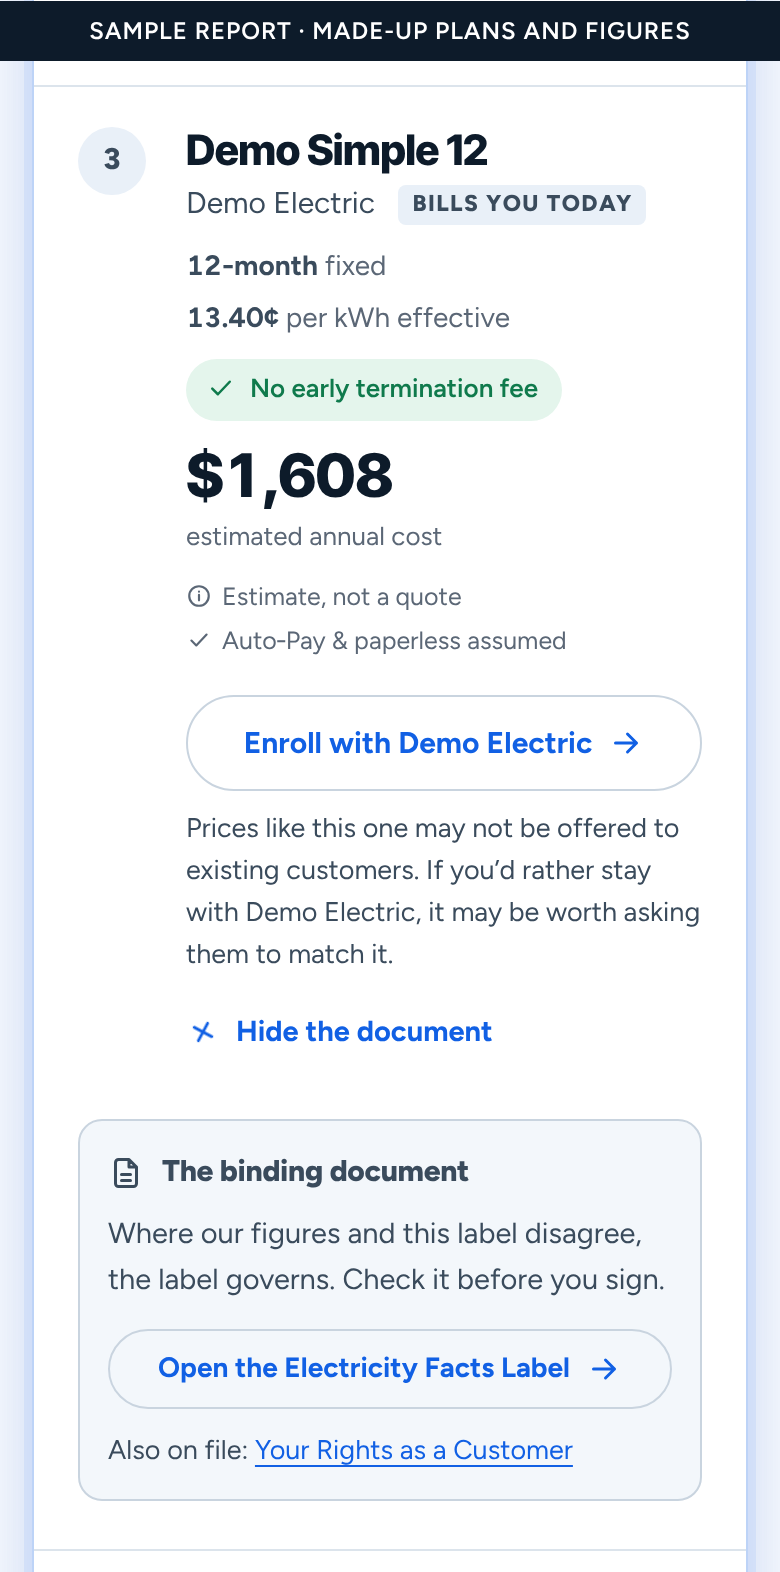
- the Electricity Facts Label we priced it from, under “Show the document”. Where our figures and the label disagree, the label governs.
If you told us who bills you today, that provider's plans are marked. If none makes a length's list, the report says where its lowest-cost plan ranks.
How your plans compare with the rest
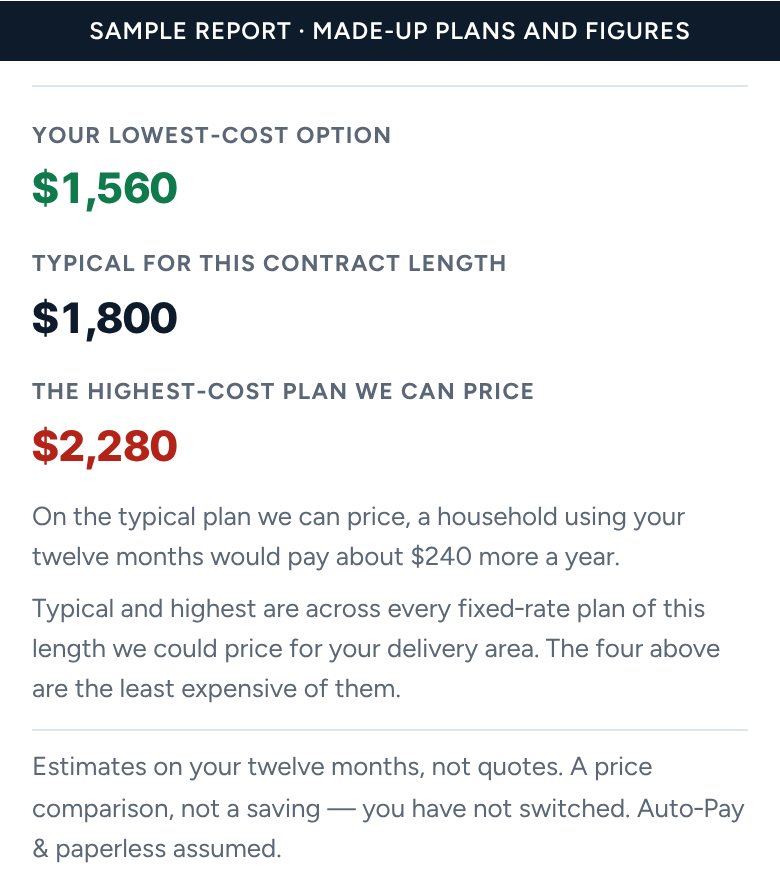
Below the lengths, your lowest-cost option sits beside the typical and highest cost among every plan of the same length we could price. It is a comparison of published prices, not a saving: you haven't switched.
What the report leaves out, and why
Some plans can't be priced honestly on twelve months of usage, so the report names the kinds it leaves out rather than guessing: variable-rate plans, whose price can change month to month; time-of-use plans, which depend on the hour you use power; prepaid plans; and plans whose label states no contract length.
The last section, “Before you act”, repeats three things: no provider pays us or pays to appear, every figure is an estimate rather than a quote, and you should open the label before you enroll.
After the report
A report is a record. It keeps the prices and the date it was priced on, and we never rewrite it. For a fresh look, run a new report, bought separately, with its own date and figures. To learn how to read a plan's label, see our guide to reading an Electricity Facts Label.
More guides
Why is my electric bill so high?
Five things that make a Texas bill jump, from summer usage to an expired contract, and how to check each one on your own bill.
Bill credits
How a usage bill credit works, why a month just under the line costs the whole credit, and how your report counts it.
Minimum usage fees and usage tiers
A fee for using too little, a rate that changes past a line, and how each one lands on a real year of bills.
Reading an Electricity Facts Label
Where to find a plan's label, what each section says, and the lines that decide what you pay.
Want your own plans read this way? Start with your ZIP.
We rank every fixed-rate plan we can price in your delivery area on your twelve months of usage, within each contract length.